Understanding growth measurement in children
Standard adult measures don’t tell the complete story when monitoring children’s growth and health. In the Bump2Baby and Me project, we tracked infant and child growth to understand how early life interventions might influence healthy development. BMI z-scores are a key tool used to monitor children’s growth accurately, allowing us to detect early patterns that might indicate future health risks such as obesity or underweight.
What is BMI?
Body Mass Index (BMI) is a calculation of a person’s weight in kilograms divided by the square of their height in metres, reported in units of kg/m². This cheap and easy-to-calculate measure helps assess whether a person’s weight is appropriate for their height.
For adults, BMI categories are straightforward:
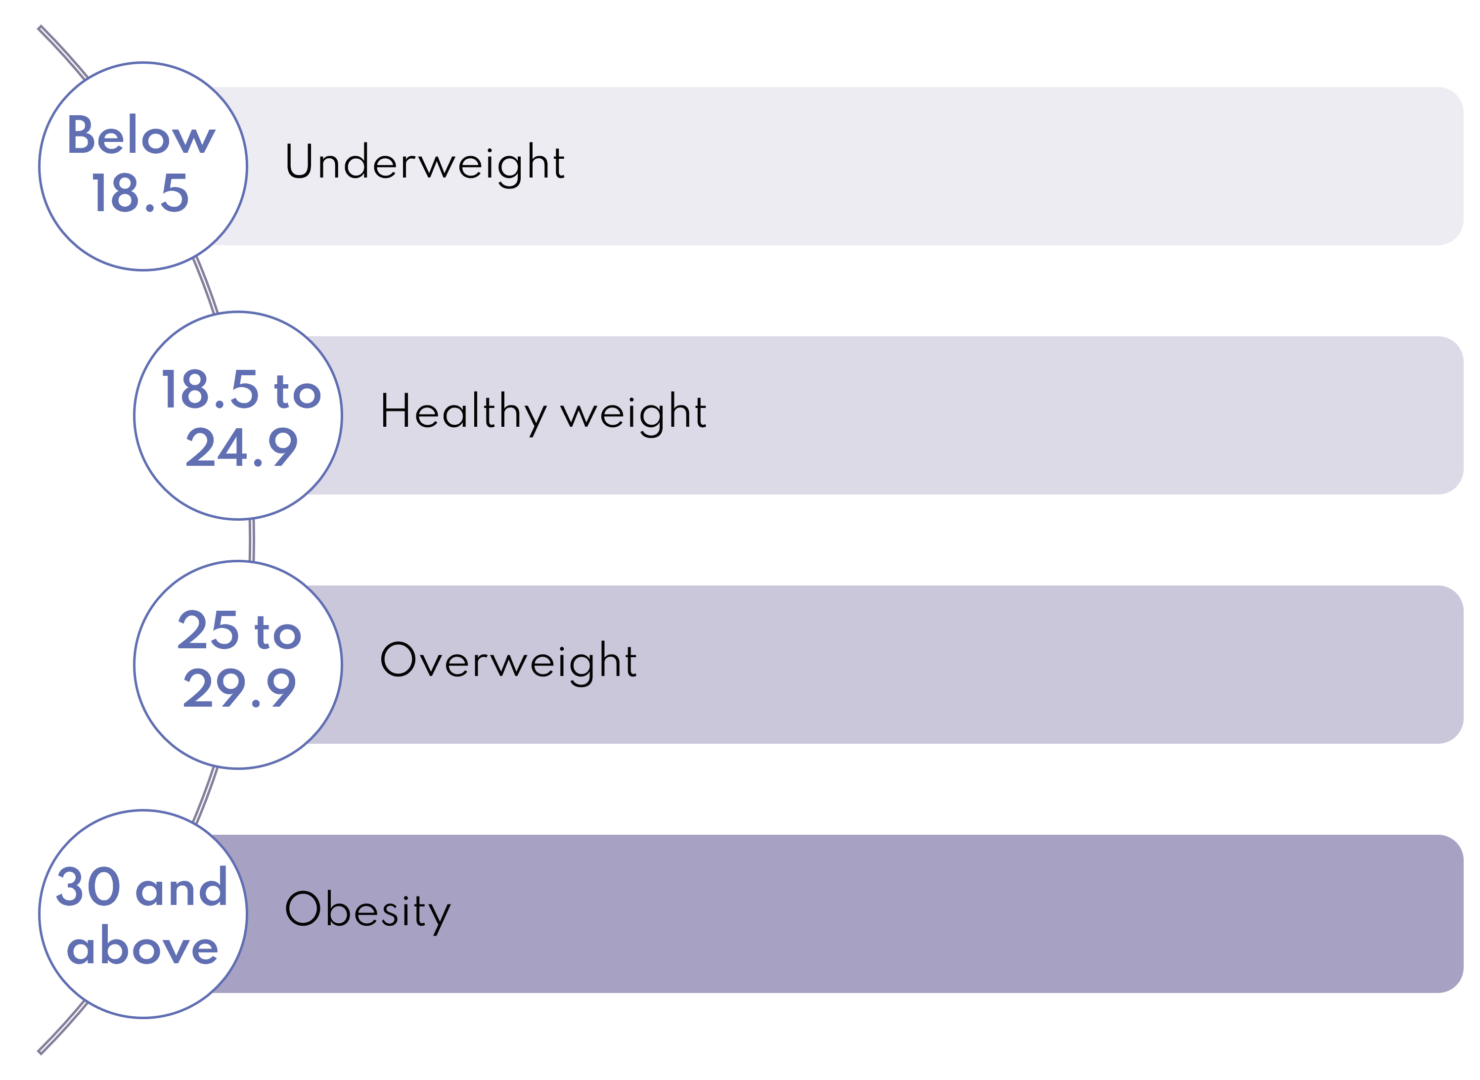
BMI serves as a useful screening tool for potential weight-related health risks, though it doesn’t directly measure body fat or fully account for factors like muscle mass.
Why children need different measures
Unlike adults, children’s bodies are constantly developing. Their body composition—the proportion of fat, muscle, and bone—changes significantly with age and differs between girls and boys. A 4-year-old girl and a 15-year-old boy have very different proportions of body fat, even if they were both perfectly healthy.
This dynamic development means that using fixed adult BMI thresholds for children would produce misleading results. What might be considered “overweight” for an adult could be a healthy weight for a growing child.
Understanding BMI z-scores
To account for these developmental differences, we use BMI z-scores (also called BMI standard deviation scores) or percentile charts for children aged 2-19 years.
What is a z-score? A z-score measures how far a child’s BMI deviates from the average BMI of children for the same age and sex. It’s measured in units called standard deviations:
- A z-score of 0 means the child’s BMI is exactly at the average;
- A positive z-score means the BMI is above average;
- A negative z-score means the BMI is below average.
How does this work in practice?
Let’s look at a 5-year-old girl with a BMI of 17:
- If the average BMI for 5-year-old girls was 15, and the standard deviation is 1, then her BMI z-score would be +2;
- This means her BMI is 2 standard deviations above average, which would place her in the obesity category;
- The same BMI of 17 might be perfectly normal for an 8-year-old, illustrating why age-specific measures are essential.
Interpreting BMI z-scores
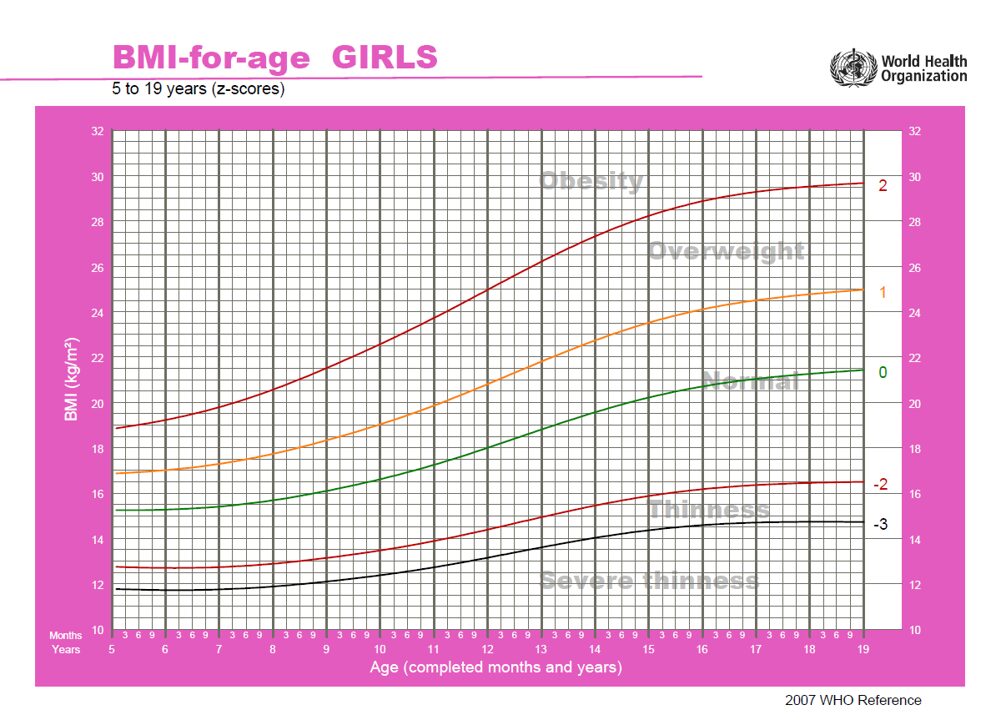
The World Health Organization (WHO) has established standard cut-offs for interpreting BMI z-scores in children:
- Above +2 SD: Obesity
- Above +1 SD: Overweight
- Between -2 SD and +1 SD: Healthy weight range
- Below -2 SD: Thinness
- Below -3 SD: Severe thinness
The chart below shows BMI-for-age curves for girls aged 5-19 years, with different coloured lines representing the various z-score thresholds. Similar charts exist for boys and younger children (0-5 years).
Why BMI z-scores are valuable
BMI z-scores offer several advantages for monitoring child health:
- Age- and sex-specific comparisons: They account for natural growth patterns, making it possible to compare children of different ages accurately.
- Tracking growth over time: They help identify concerning patterns, such as a child rapidly crossing upward through z-score lines, which might indicate accelerated weight gain.
- Precision at extremes: Unlike percentiles, which stop at the 3rd and 97th percentiles, z-scores can differentiate between children with very high or very low BMIs—critical for identifying severe obesity or malnutrition.
- Population monitoring: They enable researchers and public health officials to track childhood weight status across populations and evaluate the effectiveness of interventions.
Application in Bump2Baby and Me
In the Bump2Baby and Me project, we use BMI z-scores to track infant growth from birth through the first year of life. This allows us to:
- Understand how maternal health interventions during pregnancy might influence infant growth trajectories;
- Identify early growth patterns that may indicate future risk;
- Compare growth outcomes across different intervention groups;
- Monitor whether infants maintain healthy growth patterns.
By tracking these standardised measures, we can evaluate whether our intervention supporting mothers with healthy diet and physical activity behaviours positively influences their children’s growth and development.
Understanding the limitations
While BMI z-scores are valuable tools, they have limitations:
- They don’t directly measure body fat or distinguish between fat, muscle, and bone mass;
- They should be considered alongside other health indicators and in the context of the individual child’s growth pattern;
- Cultural and ethnic differences in body composition may affect interpretation.
Healthcare providers typically use BMI z-scores as one component of a comprehensive assessment of a child’s health and development.
Summary
BMI z-scores provide a standardised way to assess whether a child’s weight is appropriate for their height, age, and sex. By accounting for the natural variations in growth patterns, they offer valuable insights into a child’s development and potential health risks. In the Bump2Baby and Me project, they serve as an important tool for evaluating how early interventions might support healthy growth trajectories in infants and young children.